Based on TechTarget:
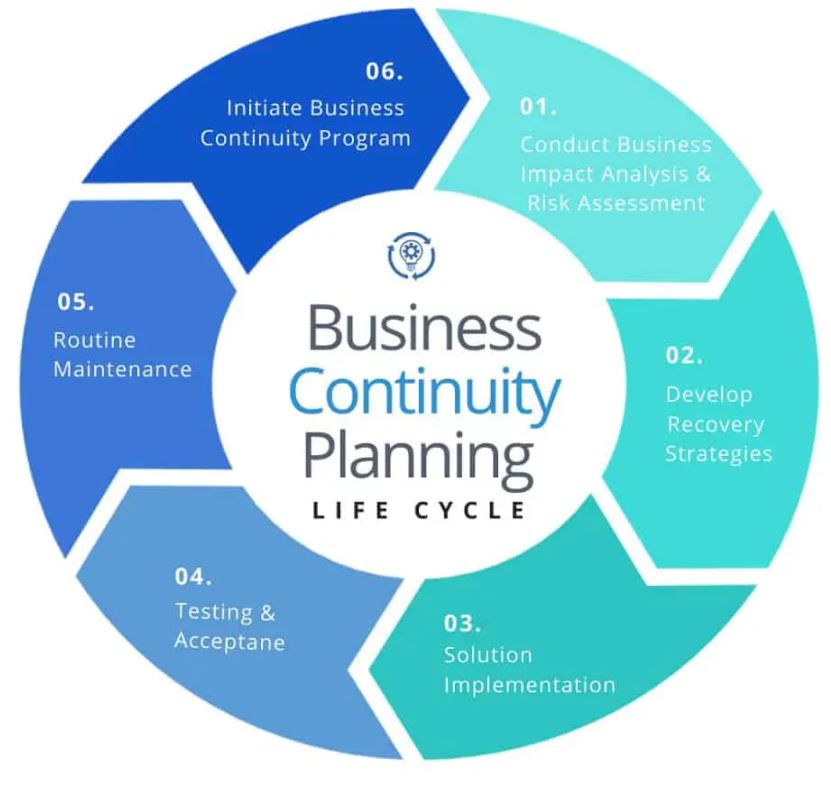
For example, an infographic (information graphic) is a representation of information in a graphic format designed to make the data easily understandable at a glance. Subsequently, people use infographics to; quickly communicate a message, to simplify the presentation of large amounts of data, to see data patterns and relationships, and to monitor changes in variables over time.
Moreover, found in almost any public environment — traffic signs, subway maps, tag clouds, musical scores and weather charts are just a few examples, among a huge number of possibilities of infographics.
Particularly, in the enterprise, infographics used by all levels of management assist with high-level views of data. Infographics include bar graphs, pie charts, histograms, line charts, tree diagrams, mind maps, Gantt charts, and network diagrams. Such tools often represent components of business intelligence software. As the amount of data collected in the enterprise and elsewhere increases, infographics used more and more frequently to help people understand the information contained in that data.
Because infographics predate writing as a means of disseminating information – cave drawings are probably the earliest known example. People were creating and using maps before the advent of written language.
Why Use Infographics from Pinterest?
Specifically, there’s a reason why infographics are so popular—they’re fun, engaging and super easy to share. Furthermore, infographics have tons of benefits for all kinds of content creators, including businesses, educators and nonprofits.
Marketers use infographics to drive more website traffic, increase visibility and brand awareness, and boost engagement.
Educators and trainers use infographics to explain difficult concepts or break down complex information to make it easier to understand.
Nonprofits use infographics to spread awareness about a cause or social issue.
Infographics from Pinterest
In fact, Pinterest has a great selection of colourful and informative infographics used within organisations.
As can be seen below, for now though, here are the best free and paid-for infographic makers around right now.
- Canva Infographic Tool
- Google Charts
- Infogram
- Mind the Graph
- Kartograph
- Easel.ly. Easel.ly is easy-to-use
- Adioma
- PicMonkey. Flash-based PicMonkey has some great infographic templates.